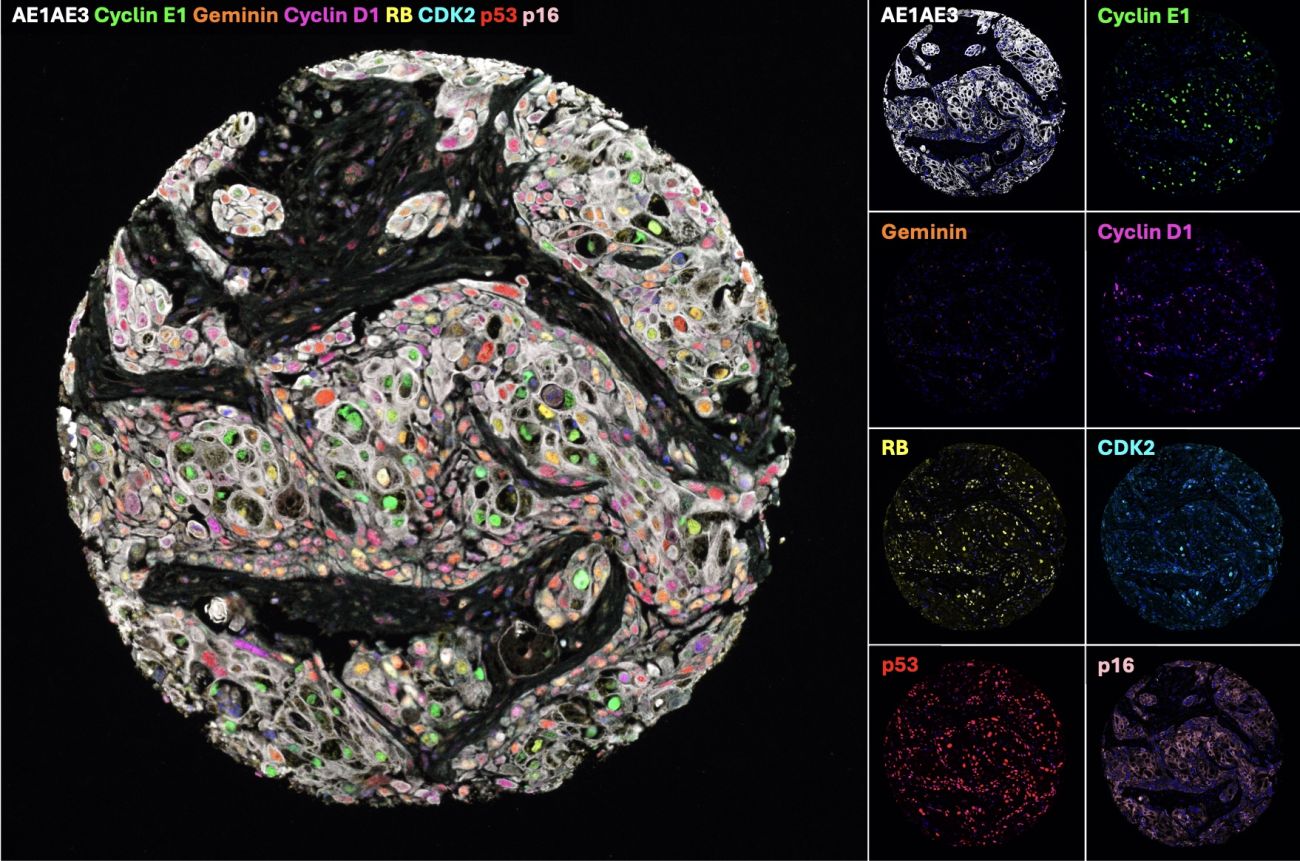
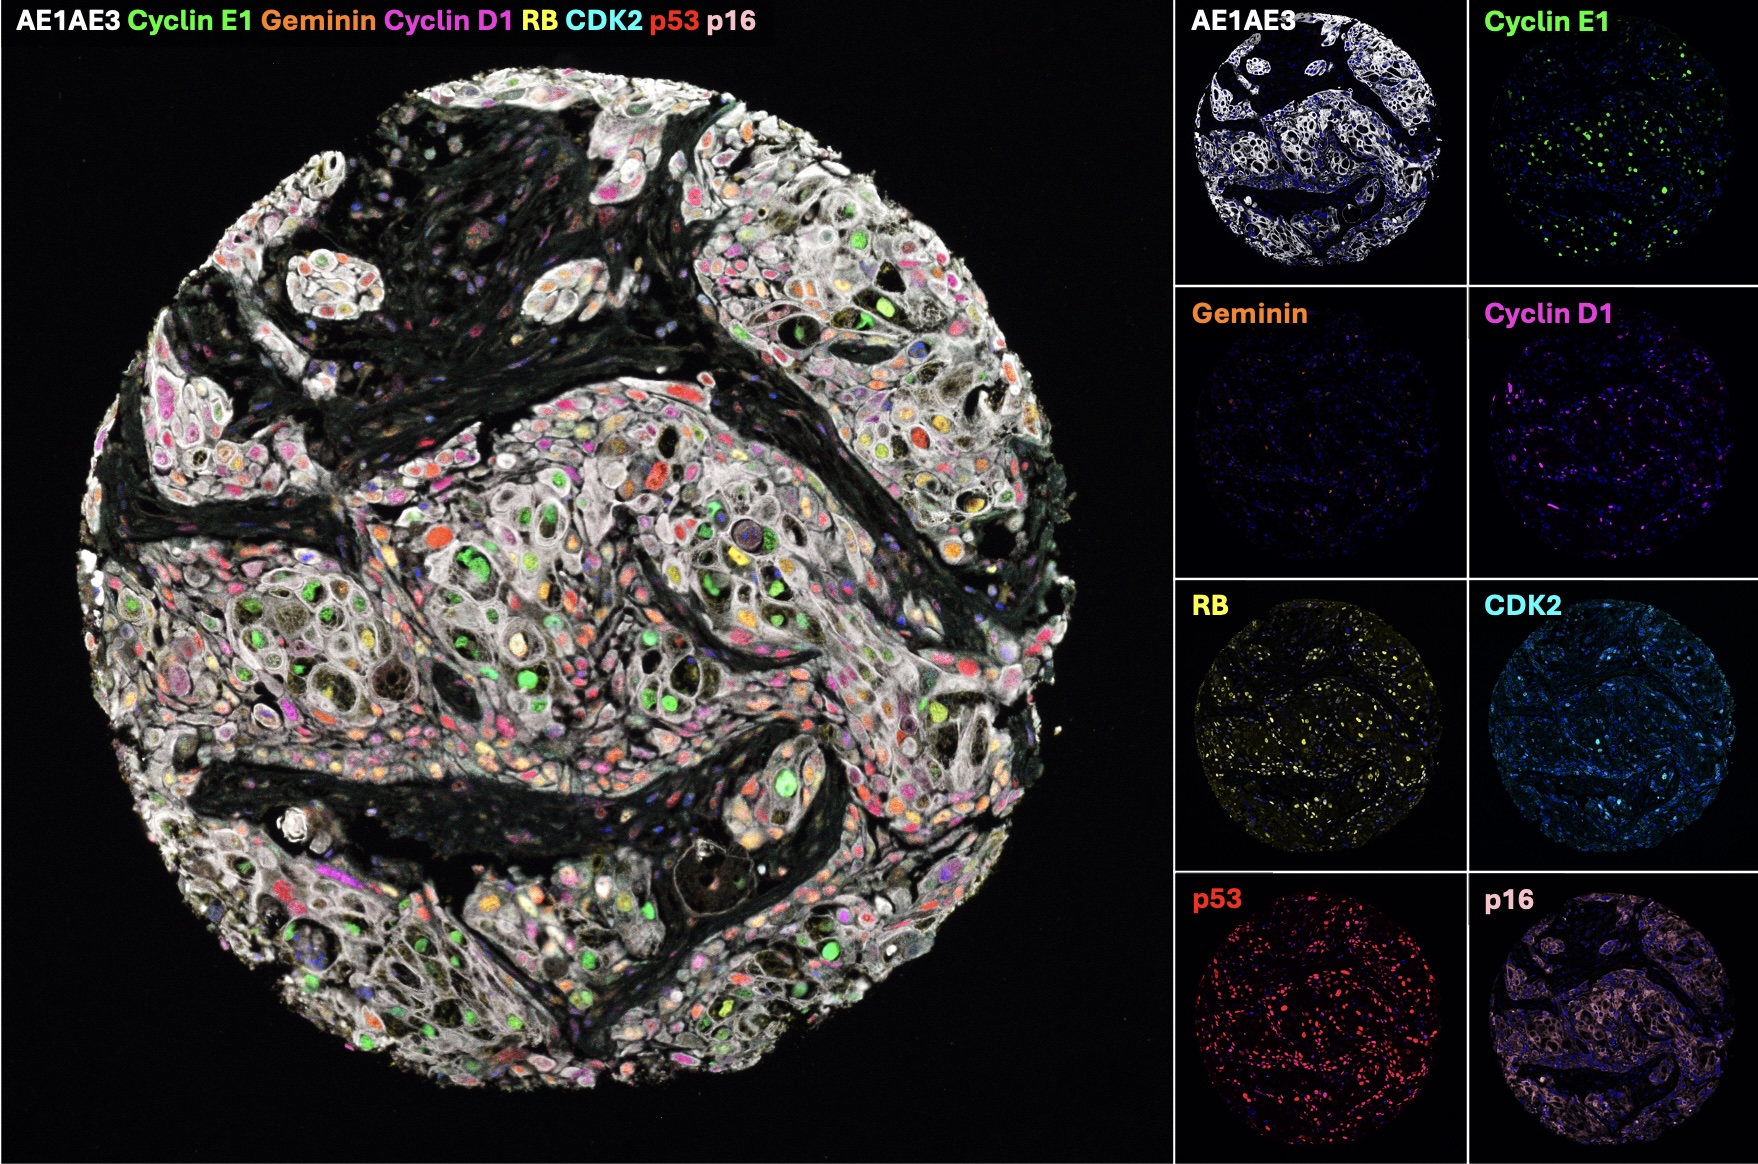
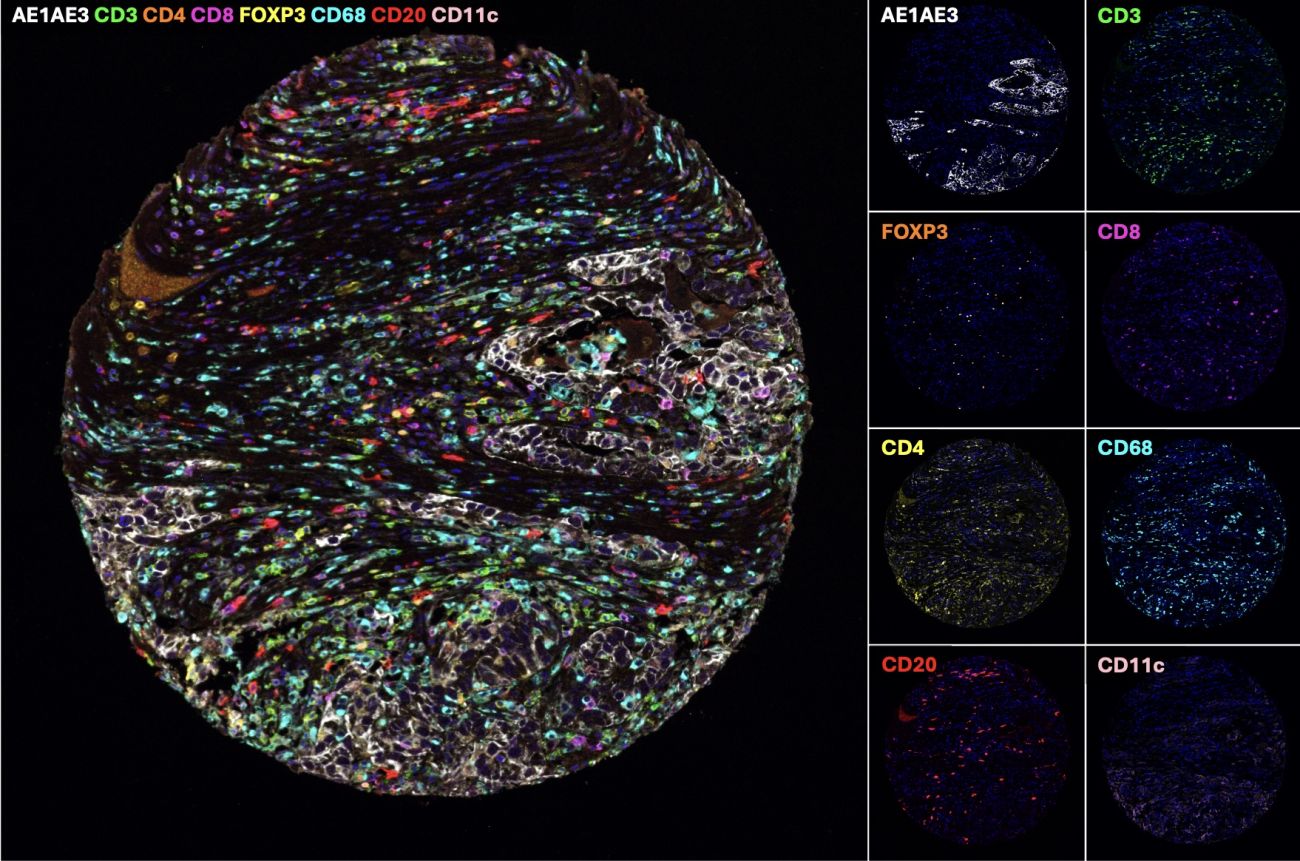
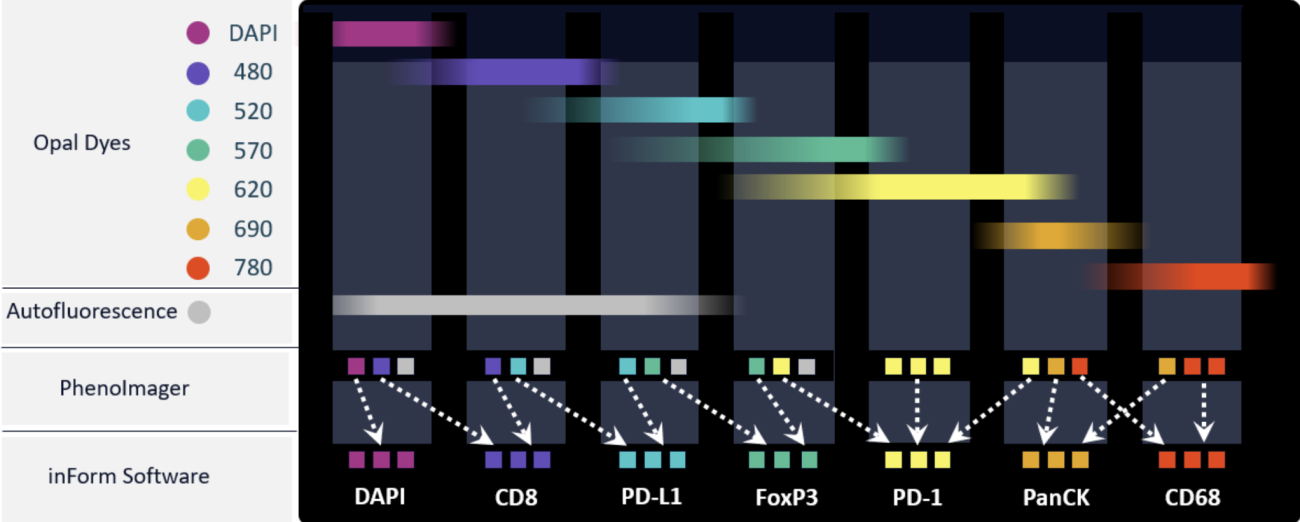
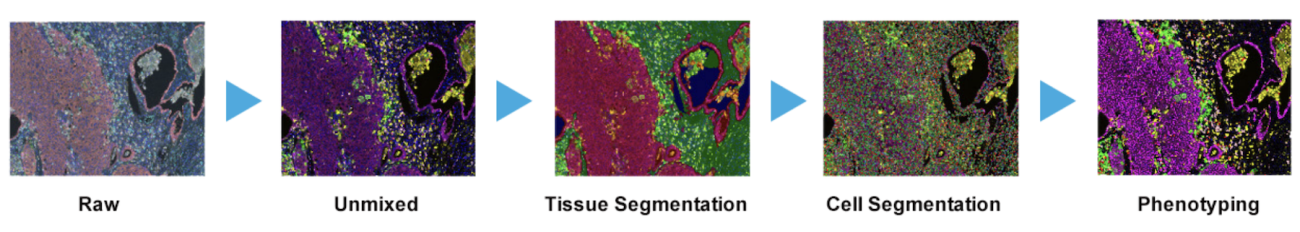
Our fully automated multispectral immunofluorescent (mIF) slide stainer and scanner allows rapid, high-throughput processing of your FFPE samples from tissue staining to data analysis and interpretation in under six weeks, all while maintaining tissue morphological integrity. Spectral unmixing allows synchronous assessment of up to eight biomarkers on each tissue section, enabling assessment of the cell cycle, tumor microenvironment, or any other biomarkers pertinent to your specific study. Finally, our analysis software delivers spatial mapping and quantification of your phenotypes of interest. Our in-house bioinformaticians can also assist with data interpretation and banking in our image repository.
- Limited to 3-4 markers
- Autofluorescent background
- Spectral bleed through
- Low signal-to-noise ratio
- Low confidence in quantitative analysis of data
- Multiplex greater than 4 markers
- Removal of background autofluorescence
- Removal of spectral bleed through
- High signal-to-noise ratio
- Reliable and quantitative analysis of data
Panels
Standard, optimized cell cycle and immune panels are available for both human and mouse samples. Custom biomarker panels are also available. ATISR requires any biomarkers to have a commercially available IHC-validated antibody for panel inclusion. Panels can consist of up to eight biomarkers plus DAPI.
Immune 1
- CD4
- FOXP3
- CD163
- PD1
- CD8
- AE1AE3
Immune 2
- TIM3
- CD4
- Gal-3
- CD8
- LAG3
- AE1AE3
Immune 3
- CD3
- FOXP3
- CD8
- GrB1
- PD1
- AE1AE3
Immune 4
- PD-L1
- CD3
- OX40
- CD33
- CD163
- PD1
- CD8
- AE1AE3
Immune 5
- B2AR
- CD3
- CD8
- CD15
- CD33
- LAG3
- PD1
- AE1AE3
Immune 6
- CD3
- CD8
- CD163
- OX40
- PD-1
- PD-L1
- FOXP3
- AE1AE3
MDSC
- PD-L1
- CD206
- CD68
- CD33
- CD8
- CD15
- CD11c
- AE1AE3
Neutrophil
- LAIR-1
- B7-H4
- CD4
- CD8
- CD14
- CD15
- PD-L1
- AE1AE3
Exhaustion 1
- CD80
- CD86
- CD4
- CD8
- LAG3
- TIM3
- CTLA4
- AE1AE3
Exhaustion 2
- LAG3
- CD45
- PD1
- CD8
- TIM3
- CTLA4
- K167
- AE1AE3
Cell Cycle 1
- MCM2
- pRB
- RB
- CCND1
- CCNE
- Ki67
- pHH3
- AE1AE3
Cell Cycle 2
- MCM2
- pRB
- TAZ
- CCND1
- CCNE
- CAMK1D
- pHH3
- AE1AE3
Cell Cycle 3
- MCM2
- pRB
- CCND1
- CCNE
- CCNA
- pHH3
- AE1AE3
Cell Cycle 4
- p21
- p16
- CCNE
- CCND1
- GMNN
- CDK2
- RB
- AE1AE3
RB/pRB
- MCM2
- pRB
- RB
- c-CASP3
- p21
- pS6
- pHH3
- AE1AE3
pFAK
- CD68
- CD45
- CD163
- pFAK
- HLA-DR
- FAK (IFR8)
- CD8
- AE1AE3
BCL2
- AR
- BCL2
- VIM
- CD45
- Ki67
- AE1AE3
NE Lineage
- AR
- pRB
- SYP
- YAP
- TAZ
- Ki67
NE Lineage
- pRB
- CHG-A
- pHH3
- SYP
- MASH-1
- PanCK
Myeloid
- CD11b
- CD45
- pHH3
- CD8
- LY6C
- LY6G
- PD1
- PanCK
Immune
- PD-L1
- CD3
- CD8
- CD11c
- CD163
- FOXP3
- Ki67
- AE1AE3
GvHD
- MUC2
- LGALS3
- LGR5
- LYZ
- VIL1
- CHG-A
Lung Lineage
- EGFP
- CDH1
- EGFRL858R
- YAP
- SYP
- VIM
- Ki67
- PanCK
Workflow
Hoyt CC. Multiplex Immunofluorescence and Multispectral Imaging: Forming the Basis of a Clinical Test Platform for Immuno-Oncology. Front Mol Biosci. 2021 Jun 2;8:674747. doi: 10.3389/fmolb.2021.674747. PMID: 34150850; PMCID: PMC8208831.
Akoya Biosciences. Spatial Phenotyping in Clinical and Translational Research. eBook.
Technology
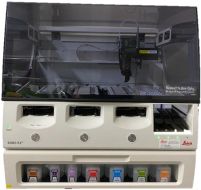
Leica BOND RXm Fully Automated Stainer
This fully automated slide stainer allows us to optimize and run your multiplexed biomarker panels in a timely and highly reproducible manner.
This slide stainer can also be used for RNAScope in situ hybridization, enabling you to visualize and quantify specific RNA molecules directly within intact cells and tissues, providing single-molecule sensitivity with exact spatial and morphologic context.
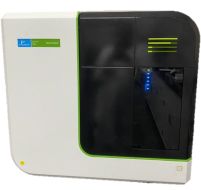
AKOYA PhenoImager HT
This automated slide scanner delivers high throughput images from both brightfield and multispectral fluorescent staining. It allows for unmixed annotated regions of interest for panels of eight biomarkers and full slide unmixed images for panels of six biomarkers.
The accompanying inForm and phenoptr software enables rapid turnaround of spatial analysis and biomarker quantification of your samples.